News websites have always been horrible, but lately it feels like they’re somehow getting even worse. What do I mean? Well, for one, the pages are bloated. Megabytes of javascript and images are loaded just to read a couple of paragraphs of text. The front pages are usually very loud and cluttered, and the headlines are often clickbaity rather than explanatory. Finally, the stories don’t usually give any context to the issue they discuss, but rather simply assume you’ve read their other articles earlier (especially when there are big stories in the news, the information is often spread into myriad different stories that don’t have any apparent chronology).
I wanted to get around these issues, so I started drafting a system to organize and present the information the way I wanted it.
I started out with a couple of initial premises:
- I wanted to be able to read the news based on the stories and how they develop rather than reading a single isolated article. This meant I had to find a way to identify what articles/headlines are discussing the same story.
- The pages must be minimalistic – no (or few) pictures, fast loading, as little javascript as possible.
- Multidimensional: I want to be able to explore the news through multiple dimensions. This includes source (site), category (e.g. financial news, sports) and keywords.
- Sentiment scoring: I’d come across software that could perform sentiment analysis on a text, then return a score. I had ambitions to integrate this to give a view of e.g. the sentiment development over time per keyword and/or source. Unfortunately I did not find the time to do this part during the first iteration.
I had a simple idea I started out with – Any developing story ought to be identifiable through a combination of three of the keywords (a triad) in the headline, and the context (earlier stories) would share one or two keywords. In other words, a story would probably show up in multiple papers with different titles, but with at least three similar elements. I figured the most popular combinations would most likely bubble up to the top naturally, giving me a solid list of which (combinations of) headline keywords were trending.
Here’s an outline of how I built my system:
I started out by building a web crawler. To keep it simple I stuck to using RSS feeds as the data source, then put together a side system to fetch and parse the articles themselves. I put great care into the data structure, as it would grow very fast once I started running the crawler regularly. I came up with a novel idea for the keyword triads; I made a table with three columns to store these. I would sort the keywords alphabetically, then build every possible combination of keyword in a sorted manner – that way I would avoid duplicate combinations in different order.
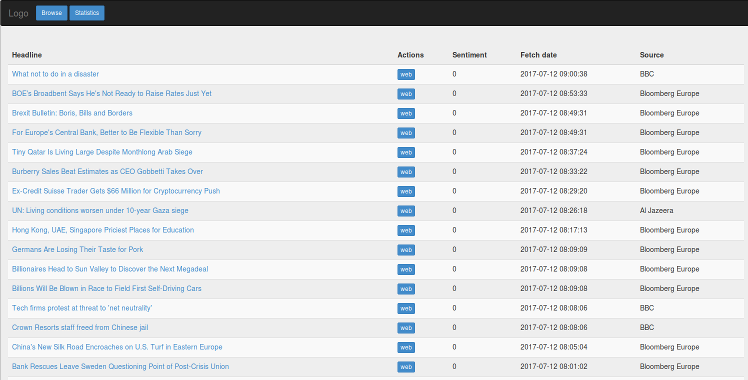
Now I needed a front-end – not as exciting to describe, I simply put together a table-like structure which would show headlines and source, with a spot for the sentiment value and a link to the article on its website.
After setting the system up and running some early tests, I realized that my initial assumption was wrong. I was unable to group the same story from different sources because the headlines differed more than expected. I got clickbait like “will make you” dominating the top of the list, which obviously do not identify one and the same story. After filtering out the news sources teeming with clickbait, I found that most “real” news are covered different enough between agencies that the headlines can be completely different. Every combination of words from one common story dominated the results at one time (when agencies actually did post the same headline), and all in all there was more garbage than value. This put an abrupt stop to this iteration of the project, and sent me back to the drawing board.
This was still a learning experience, and gave me the necessary insight to start building the second iteration.
Turns out there’s a trend where the shittiest titles tend to be the most prominent – If I’d read this article before starting, I would probably never have finished the first iteration:
Study of most commonly shared headlines